
Introduction
Google Search – Google's core business – is under siege.
Markets are beginning to wonder whether its "Kodak moment" has arrived with ChatGPT and other generative AI models. In April 2025, for the first time in over two decades, Google’s share of desktop search slipped below 80%, according to StatCounter.
But what truly rattled markets – triggering a nearly 4% drop in Alphabet’s share price on Friday 20 June – was a report that Apple has held internal talks to acquire Perplexity, a fast-rising AI-native search startup. For Wall Street, this is worrying because it hints at an existential threat to Google’s mobile search dominance. While desktop search is still meaningful, mobile search is higher-growth and more monetisable. If Apple integrates a Perplexity-powered engine into Safari or Siri, Google’s lucrative default position on iPhones could be at risk.
Meanwhile, Google’s Search empire is losing in court. The European Union fined it over €4 billion for anti-competitive behaviour in Android and search bundling. In the US, the Department of Justice is seeking to break Google up.
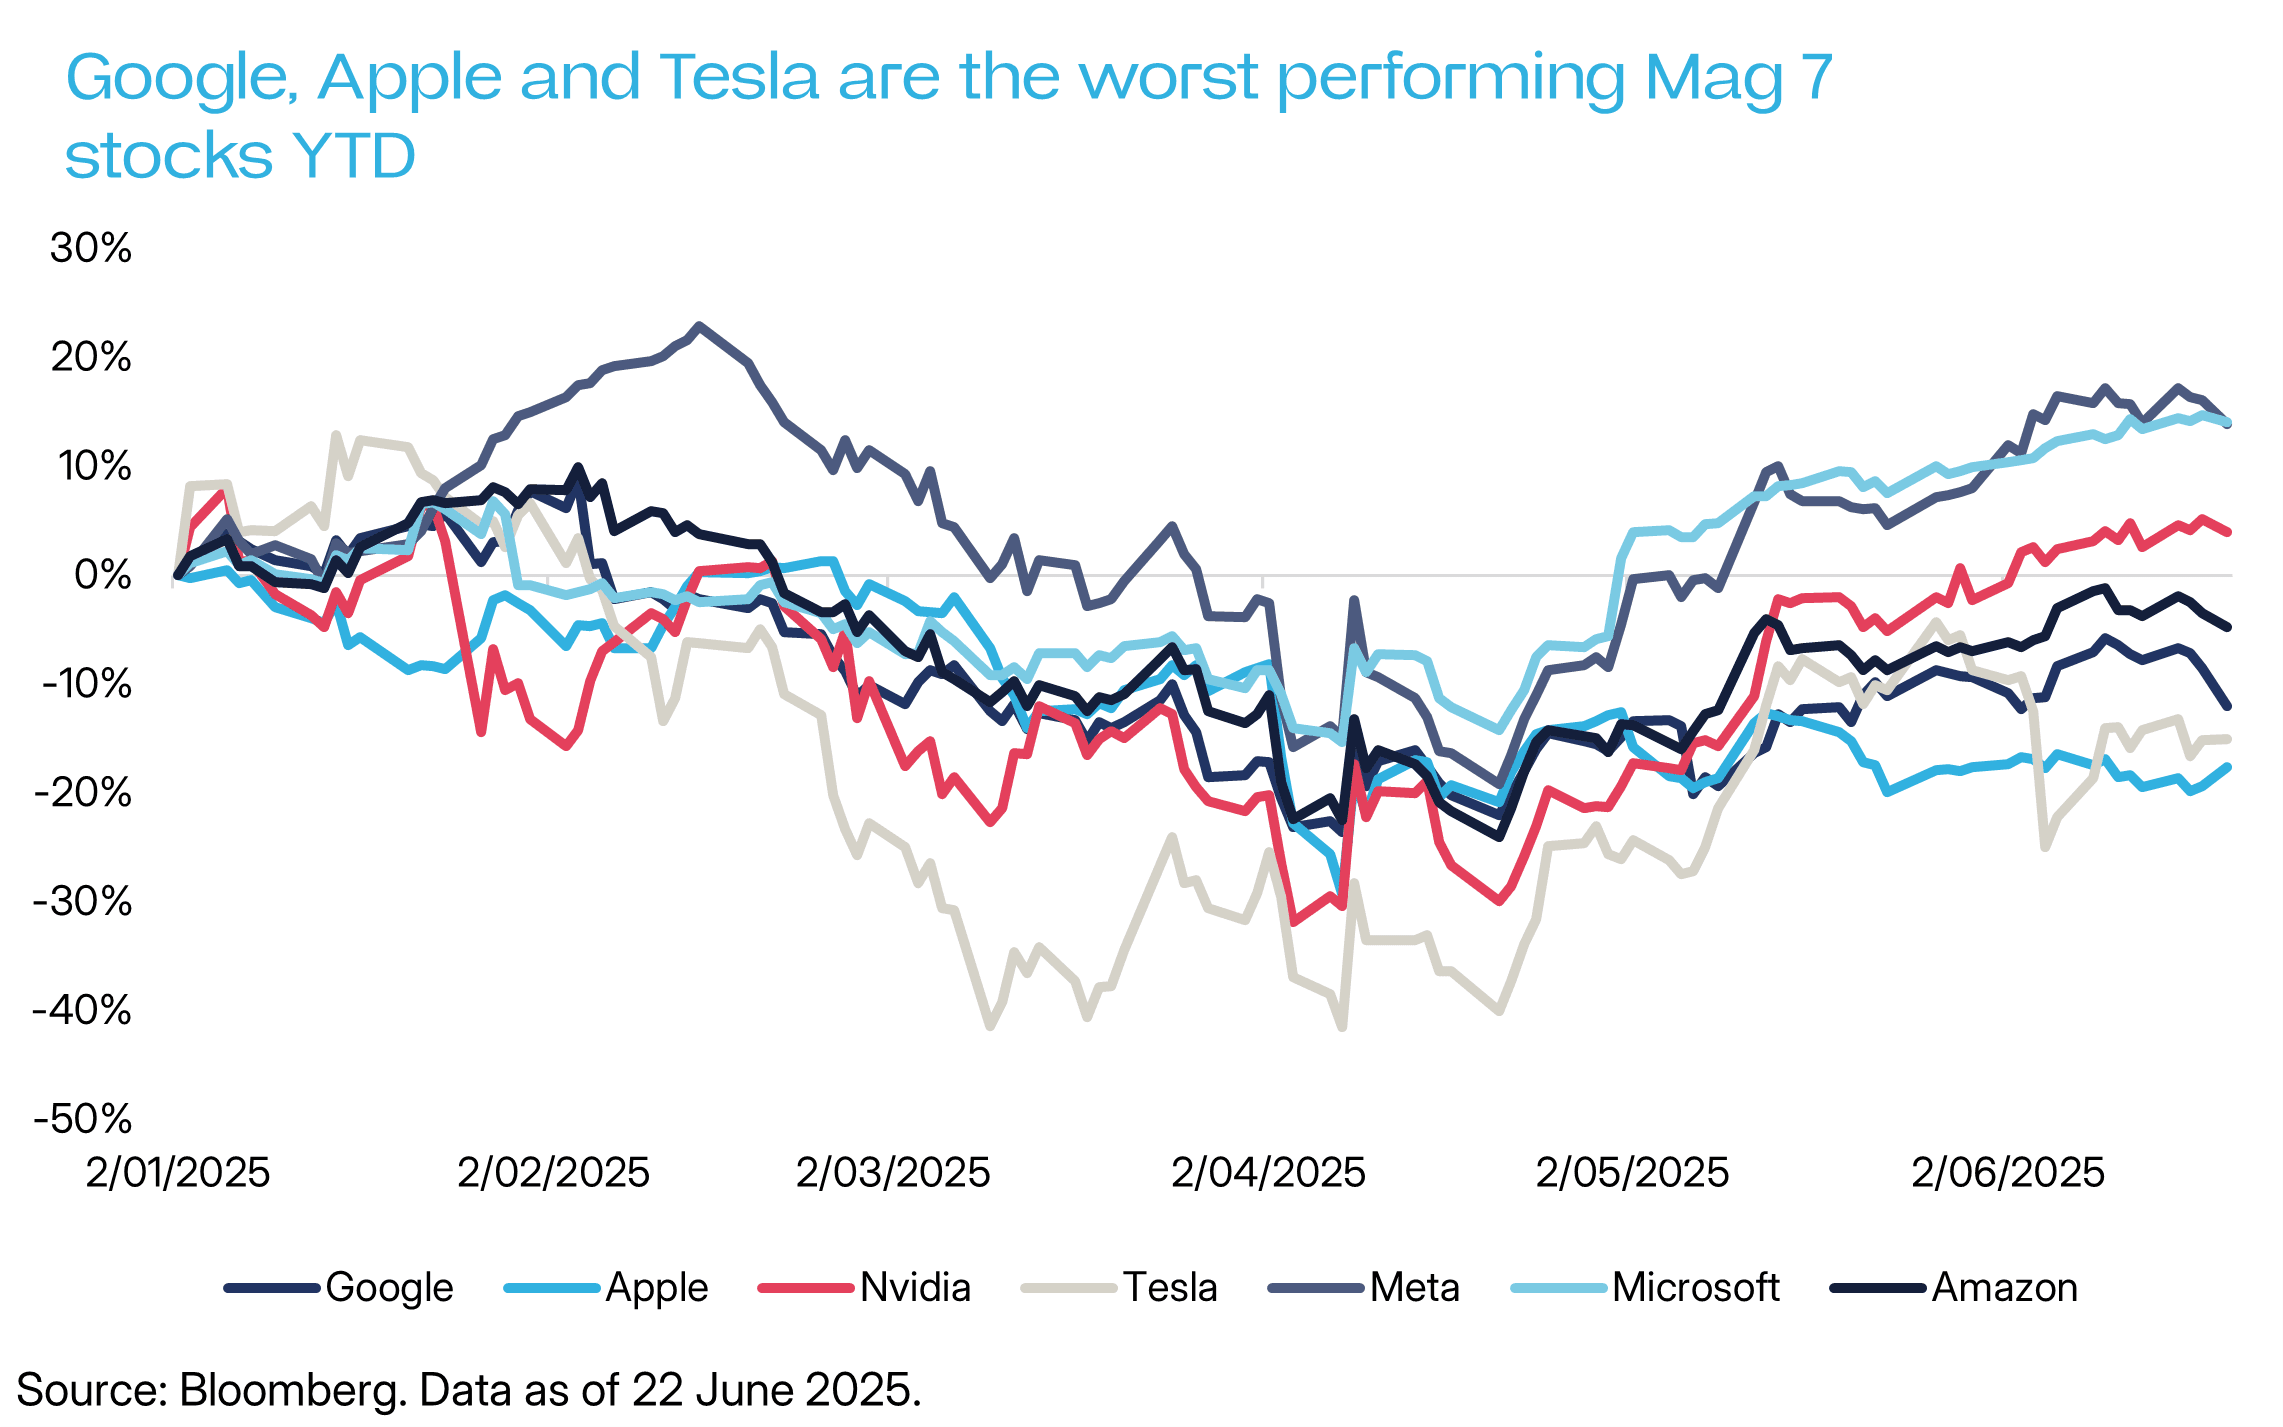
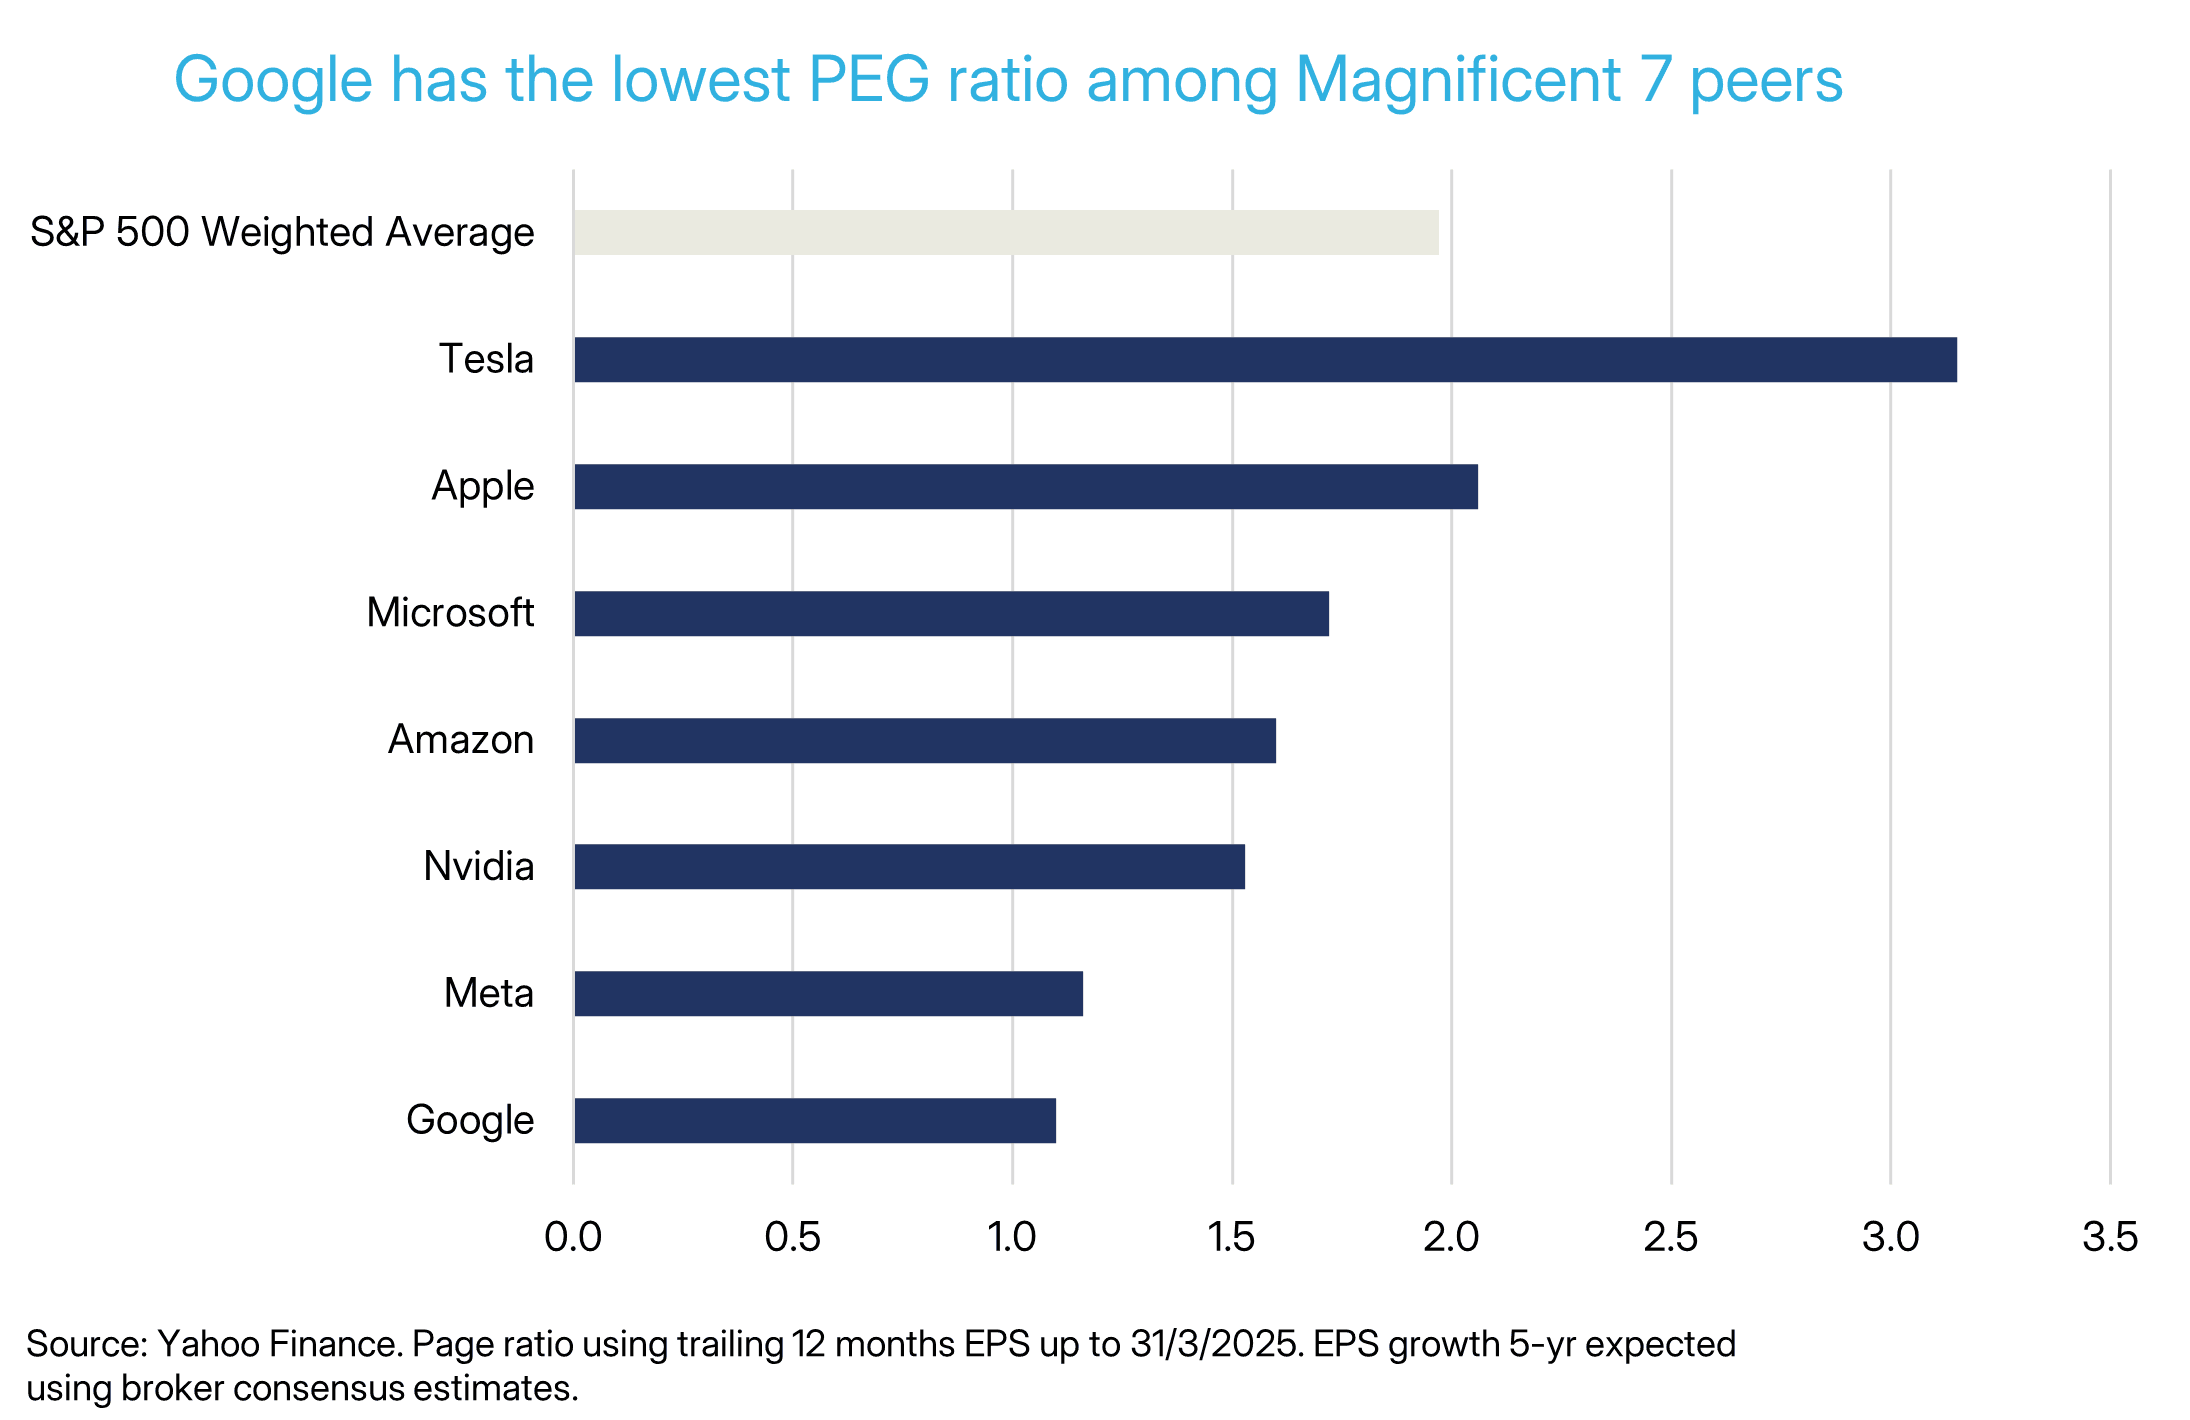
Alphabet’s stock has underperformed both the S&P 500 and its “Magnificent Seven” peers over the past 12 months. On a forward PEG ratio basis, Alphabet is now comfortably the cheapest of the group.
All of this raises two questions. First: what does Wall Street think Google Search worth? Second: is this a buying opportunity for contrarian investors – a moment to get greedy while others get scared?
To answer this, we've borrowed Jamie Powell's framework and run a conservative sum-of-the-parts (SOTP) analysis of Alphabet, stripping out the value of YouTube, Google Cloud, Waymo, and Alphabet’s substantial cash pile, to isolate the market’s implied valuation for Search.
Our analysis suggests Wall Street is pricing Google Search at a 1-year forward PE multiple of just 12.7x. That puts it in the same bracket as structurally challenged businesses like media conglomerates, telcos, and some banks. This is extraordinary given that Search likely generated over US$100 billion in EBIT last fiscal year, with margins north of 50%.
Valuing Google: Sum of the Parts
Step 1: Remove the Cash Pile
The first thing to do in any analysis of Alphabet is to take its cash out of the share price (as one offsets the other for acquirers).
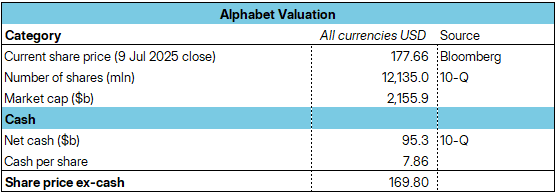
There is a lot of it, too. As of March 2025 Alphabet is sitting on approximately US$95billion in net cash and marketable securities. This cash pile is so large partly because Google pays employees a lot in stock. Taking cash out, the share price falls to US$169.80.
Step 2: Remove YouTube
The second step is to remove YouTube. YouTube is a cash cow for Google; a company unto itself. Acquired for US$1.65 billion in 2006, YouTube is now arguably the world’s largest tech media company.
These days, Google actually publishes YouTube Ad revenues in its reports. The numbers look good: US$47 billion in revenue the 12 months to March 2025, up 10% year-over-year.
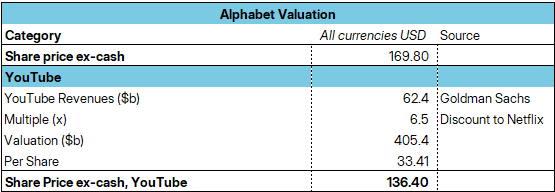
But subscription revenues from YouTube Premium and YouTube TV are not published. To get the full picture of YouTube’s top line, we need to ask Goldman Sachs, which estimates total revenue will reach US$62 billion in the 12 months from April 2025.
Valuing YouTube is tricky, as YouTube has no obvious competitor. It shares features with Netflix (subscription-driven video platform), TikTok (short-form video platform), and traditional TV (free-to-air broadcast supported by ads), but has no perfect peer.
The nearest is probably Netflix, which trades on ~13x forward revenue, but YouTube’s economics are different in two important aspects: it pays out a larger share of revenue to creators; and advertising revenue is more cyclical than subscriptions.
To remain conservative, we apply a 6.5x multiple – half of Netflix’s, and almost certainly too conservative – yielding an implied valuation of US$405 billion for YouTube. This means YouTube is roughly twice the size of Disney, as measured by market cap, and two-thirds the size of Netflix. Removing cash and YouTube, the share price falls to US$136.40.
Step 3: Remove Google Cloud
Next, we remove Google Cloud: the Wall St darling.
Cloud – which includes web hosting services (like AWS) and Google Workspace (a Microsoft Office rival) – is growing rapidly. In Q1 FY25, Cloud posted US$12 billion in revenue, up 18% against the previous 12 months. After years of losses, Cloud turned profitable in FY24, though capex remains high.
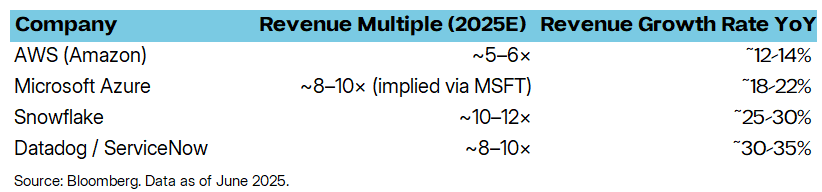
If revenue grows another 18%, Google Cloud will generate around US$54 billion in the next 12 months. Other cloud companies like ServiceNow, Snowflake, and Microsoft Azure generally trade on forward revenue multiples between 7x and 10x.
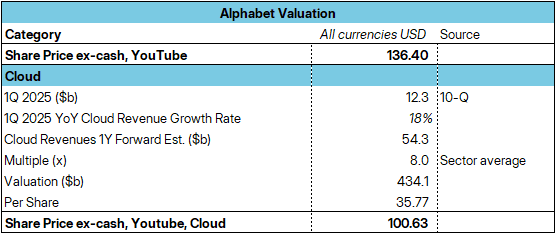
Applying an 8x multiple - again, almost certainly too conservative, especially given market buzz around incorporating AI tools - gives Google Cloud a standalone valuation of ~US$434 billion. And makes it one of the largest global technology companies in and of itself.
Step 4: Remove Waymo
The last piece to remove is Waymo, Alphabet’s self-driving cars unit. It is widely considered one of the most advanced autonomous driving companies. Its use of lidar (light detection and ranging sensors) and safety-first rollout strategy have earned it partnerships with Uber and regulatory goodwill.
Waymo sits inside “Other Bets,” a segment of Alphabet’s annual report that includes various moonshots. But its financials are undisclosed. The best we can do is Bloomberg’s report in October 2024 that Waymo raised capital at a US$45 billion valuation.
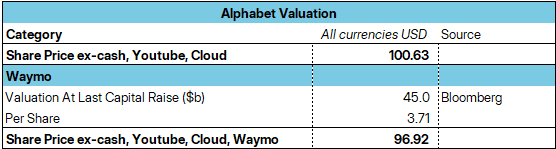
Using this figure, with no mark-up despite growing traction and no major scandals, we subtract US$45 billion from Alphabet’s valuation. The share price falls to US$96.92.
What’s Left: Google Search and Ads
After deducting cash, YouTube, Cloud, and Waymo from Alphabet’s market cap, what remains is the market’s implied valuation of Google Search – Alphabet’s core business.
To strike a valuation, we need to estimate its earnings. Here, we start with Search revenue. In calendar 2024, Search grew revenue by 3% – even with ChatGPT in full swing – reaching an annualised run rate of ~US$203 billion by Q1 FY25.
For this analysis, we assume zero revenue growth over the next 12 months, a deliberately conservative approach allowing us to meet Google bears half-way.
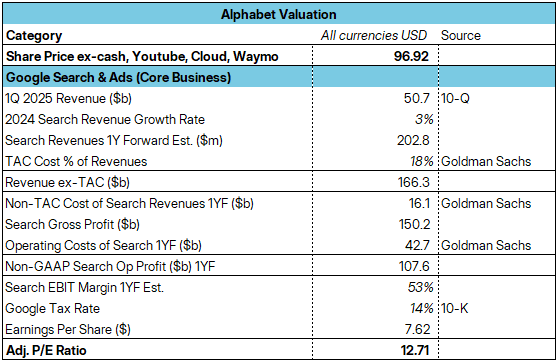
However, we must adjust that topline for traffic acquisition costs (TAC) – the fees Google pays to Apple and Samsung in particular to remain the default search engine on their phones. TAC is not broken out by segment, but Goldman Sachs, using court documents, estimates TAC at ~18% for Search.
Ex-TAC, that brings net revenue to roughly US$166 billion.
Next, we use estimates for cost of revenue and operating expenses and subtract them out. (This allows us to calculate earnings and therefore a PE ratio, which we can easily compare to other companies and market averages.)
Again, Alphabet does not break these costs out in its shareholder reports. But using Goldman Sachs’ projections, we arrive at estimated EBIT margins of 53%, leading to ~$108 billion in forward operating profit for Search.
Take tax out of this - Alphabet’s effective tax rate is just ~14%, per its latest 10-K - this yields ~US$93 billion in net income from Search.
If we take this US$93 billion as Search earnings and then apply it to our adjusted share price (ex-cash, YouTube, Cloud, Waymo) of US$96.92, we get a 1-year forward PE ratio of 12.7x.
Conclusion: A tightly coiled spring?
A forward PE ratio below 13x suggests Wall Street is pricing Google Search not as a world-leading technology company, but as a utility in decline. For contrarian investors, the question is what could force a re-rating.
The catalysts are clear. First, evidence that Google's own AI integrations within Search (like its Gemini model) are successfully defending its market share. Second, a resolution to the US antitrust case that falls short of a full break-up. Finally, continued margin discipline that proves the profitability of the core business is not permanently impaired.
The market's faith has been broken. But for a business generating over $90 billion in annual profit, it may not take much good news for that faith to be restored with surprising speed.
Related ETFs
For those wanting exposure to Alphabet, our ETFS Magnificent 7+ ETF (HUGE) makes the largest bet on it of any ETF in Australia.
Disclaimer:
The issuer of units in ETFS Magnificent 7+ ETF (HUGE) (ARSN: 685 356 183) is the responsible entity of the Fund, being ETF Shares Management Limited (AFSL: 562 766). The product disclosure statement (PDS) for the Fund contains all of the details of the offer of units in the Fund. Copies of the PDS are available from ETF Shares Management Limited or at www.etfshares.com.au. In respect of each retail product, ETFS has prepared a target market determination (TMD) which describes the type of customers who the relevant retail product is likely to be appropriate for. The TMD also specifies distribution conditions and restrictions that will help ensure the relevant product is likely to reach customers in the target market. Each TMD is available at www.etfshares.com.au
The information provided in this document is general in nature only and does not take into account your personal objectives, financial situations or needs. Before acting on any information in this document, you should consider the appropriateness of the information having regard to your objectives, financial situation or needs and consider seeking independent financial, legal, tax and other relevant advice having regard to your particular circumstances. Any investment decision should only be made after obtaining and considering the relevant PDS and TMD.
Investments in any product issued by ETFS are subject to investment risk, including possible delays in repayment and loss of income and principal invested. None of ETFS, the group of companies, or their respective directors, employees or agents guarantees the performance of any products issued by ETFS or the repayment of capital or any particular rate of return therefrom.
Solactive AG (“Solactive”) is the licensor of Solactive Magnificent 7+ Index (the “Index”). The financial instruments that are based on the Index are not sponsored, endorsed, promoted or sold by Solactive in any way and Solactive makes no express or implied representation, guarantee or assurance with regard to: (a) the advisability in investing in the financial instruments; (b) the quality, accuracy and/or completeness of the Index; and/or (c) the results obtained or to be obtained by any person or entity from the use of the Index. Solactive does not guarantee the accuracy and/or the completeness of the Index and shall not have any liability for any errors or omissions with respect thereto. Notwithstanding Solactive’s obligations to its licensees, Solactive reserves the right to change the methods of calculation or publication with respect to the Index and Solactive shall not be liable for any miscalculation of or any incorrect, delayed or interrupted publication with respect to the Index. Solactive shall not be liable for any damages, including, without limitation, any loss of profits or business, or any special, incidental, punitive, indirect or consequential damages suffered or incurred as a result of the use (or inability to use) of the Index.
The value or return of an investment will fluctuate and an investor may lose some or all of their investment. Past performance is not a reliable indicator of future performance.