In just over a week, accounting software giant Xero shed more than 17% of its market value, with a year-to-date decline of nearly 30%.
The decline has meant there has been no sustained breakout in Xero’s share price in 5 years. This is somewhat surprising given uptake of its software has soared and the firm is seen on the street as a “quality compounder”.
Chart 1 – Xero stock price return since June 2025
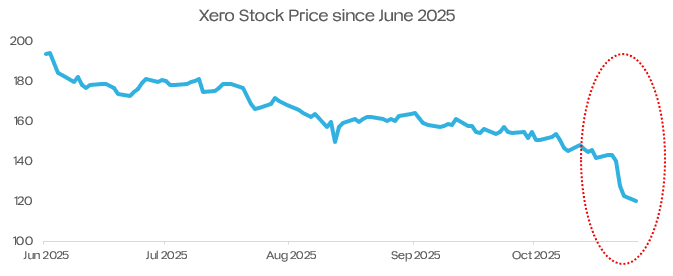
Source: Bloomberg as at 14 November 2025
Investors are left asking: why is a profitable, growing, blue chip tech company struggling to lift off?
What’s causing the negativity?
The market wasn’t reacting to a collapse in fundamentals. But to a cluster of concerns hitting simultaneously:
- Expensive $4bn Melio acquisition: Investors are worried Xero overpaid for unprofitable US payments start up Melio, with the deal dragging on operating income, and not cleanly scaling into Xero’s core business.
- Weak North America revenue growth, suggesting tough competition with Intuit: Revenue in the US/Canada segment grew 21%, well below analysts’ expectations. Xero has been shovelling it uphill for several years to try and beat top competitor Intuit – which runs rival accounting software QuickBooks – on its home turf. These results suggest that effort is running into difficulties.
- A high valuation that left little room for disappointment: Xero still trades at a premium to global software peers: its trailing P/E of 82 is well above the median of 52 for comparable global software companies. When your valuation is out that far, even minor disappointments in growth can trigger large stock moves.
Table 1 - Company metrics compared to global peers
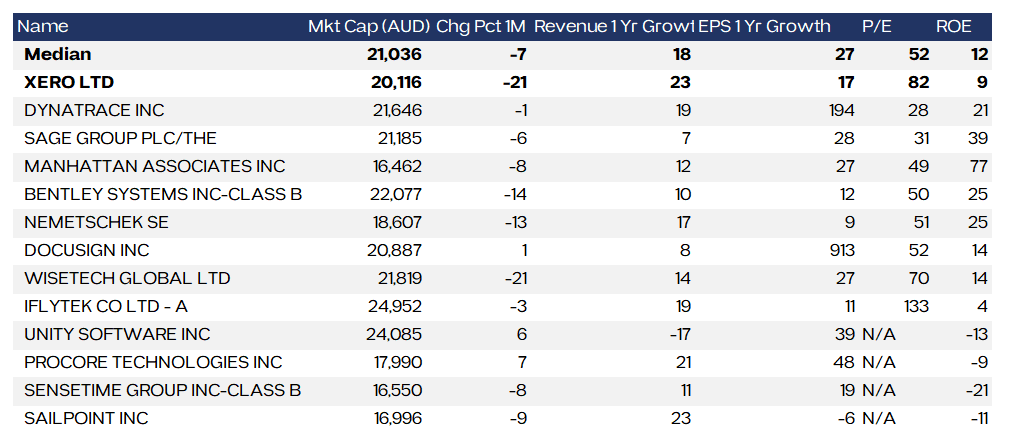
Source: Bloomberg as at 14 November 2025
Broader consequences for local tech benchmarks
While Xero’s rise up the bourse the past 10 years shows the opportunities in Australian tech, its fall also shows the vulnerabilities of the local sector.
Chart 2 – Year to Date returns for Australian technology companies
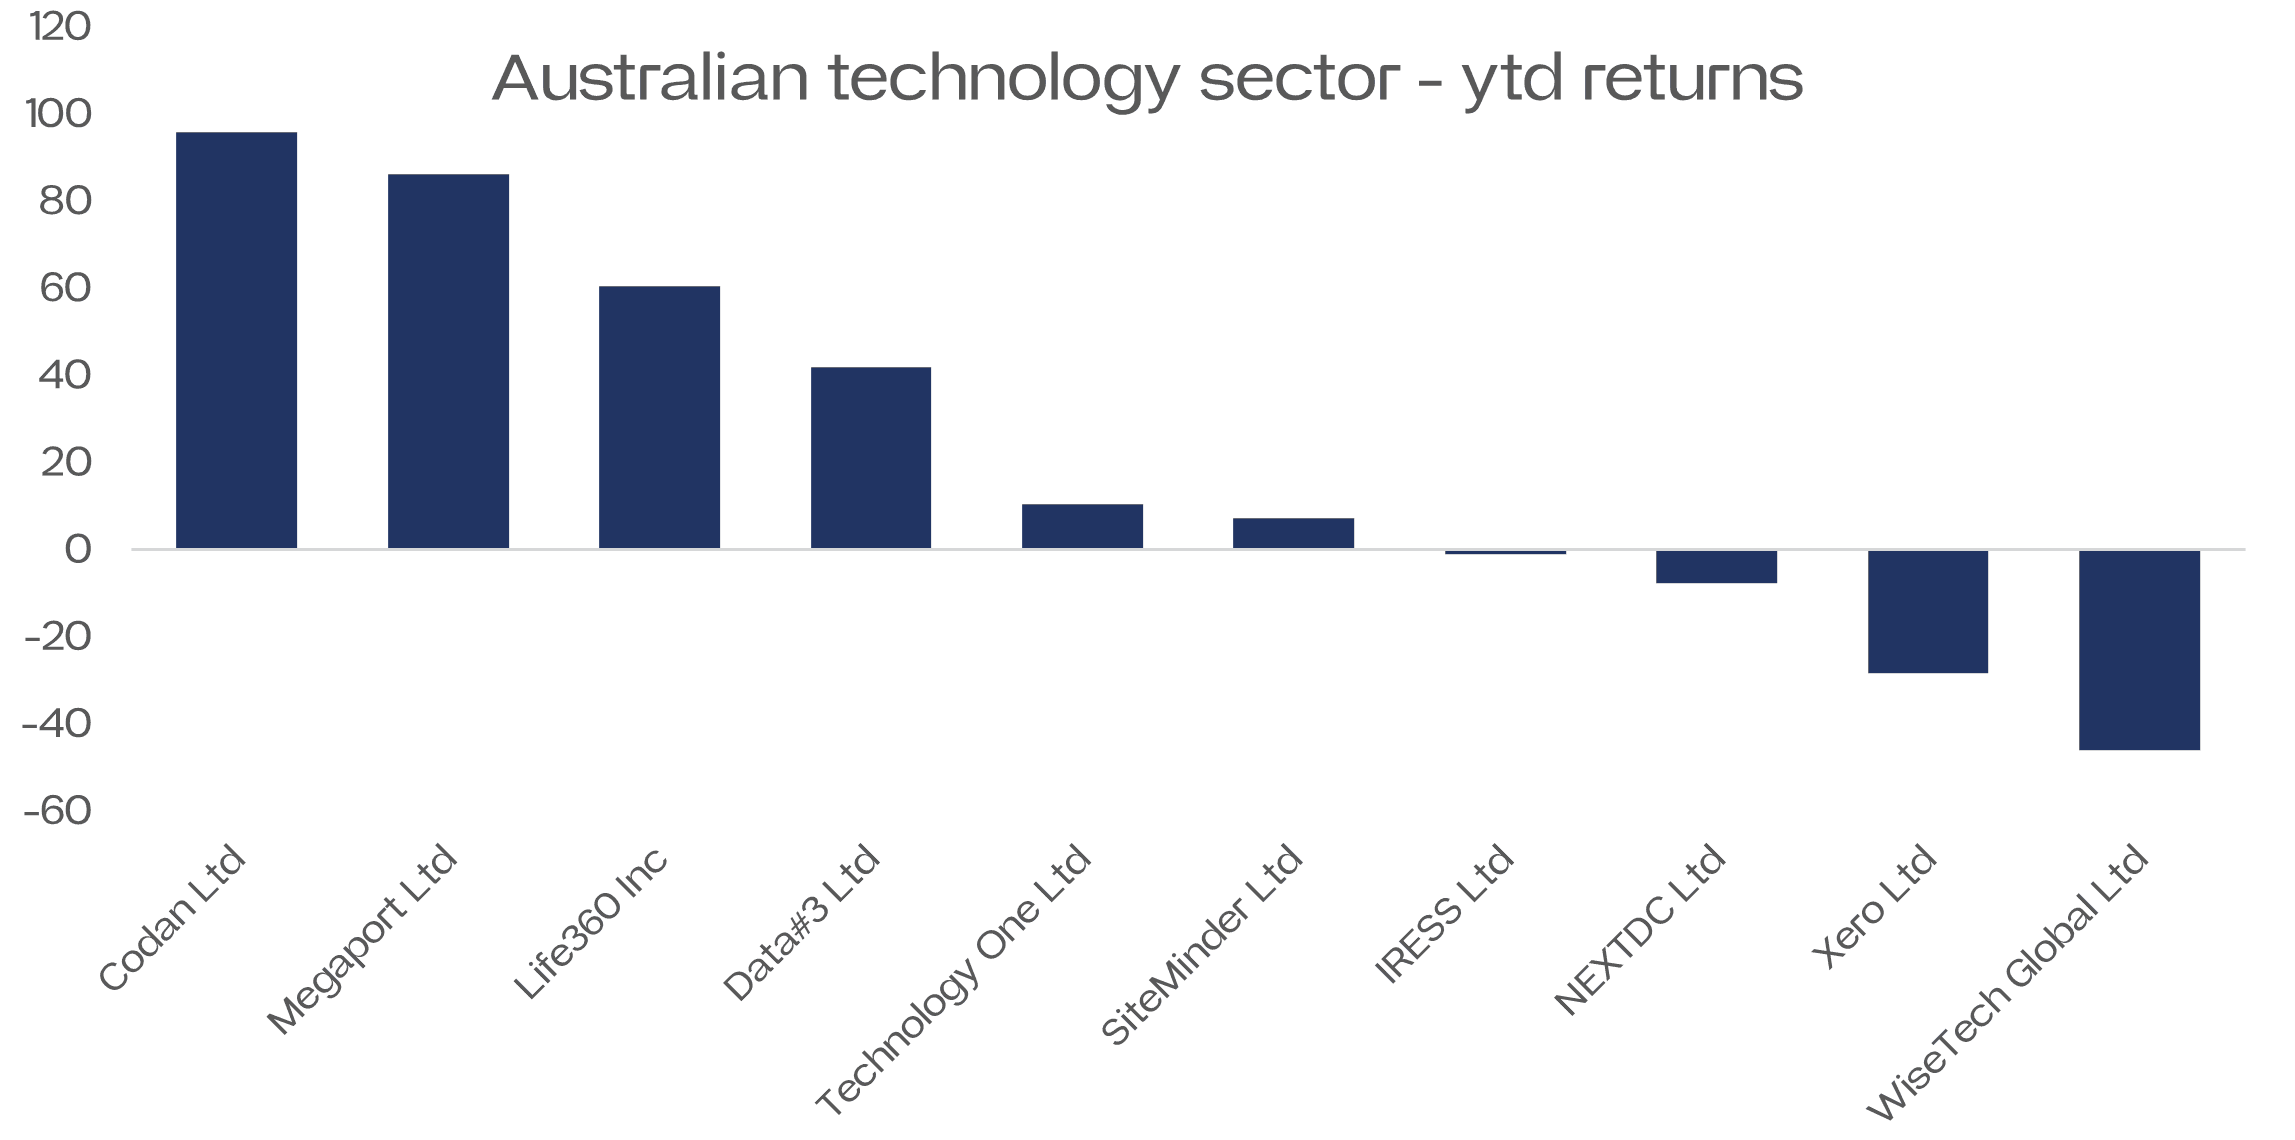
Source: Bloomberg as at 14 November 2025
The ASX tech landscape is concentrated in just handful of companies (in the chart above) – of which Xero is a key member. There is more breadth and depth that there used to be, but by global standards, we still run a narrow and shallow tech sector.
There no equivalents to semiconductors, cloud infrastructure, cybersecurity giants, or AI leaders. And the companies have a lower diversification across their business models
Chart 3 – Revenue derived from overseas business for US Technology companies & Xero
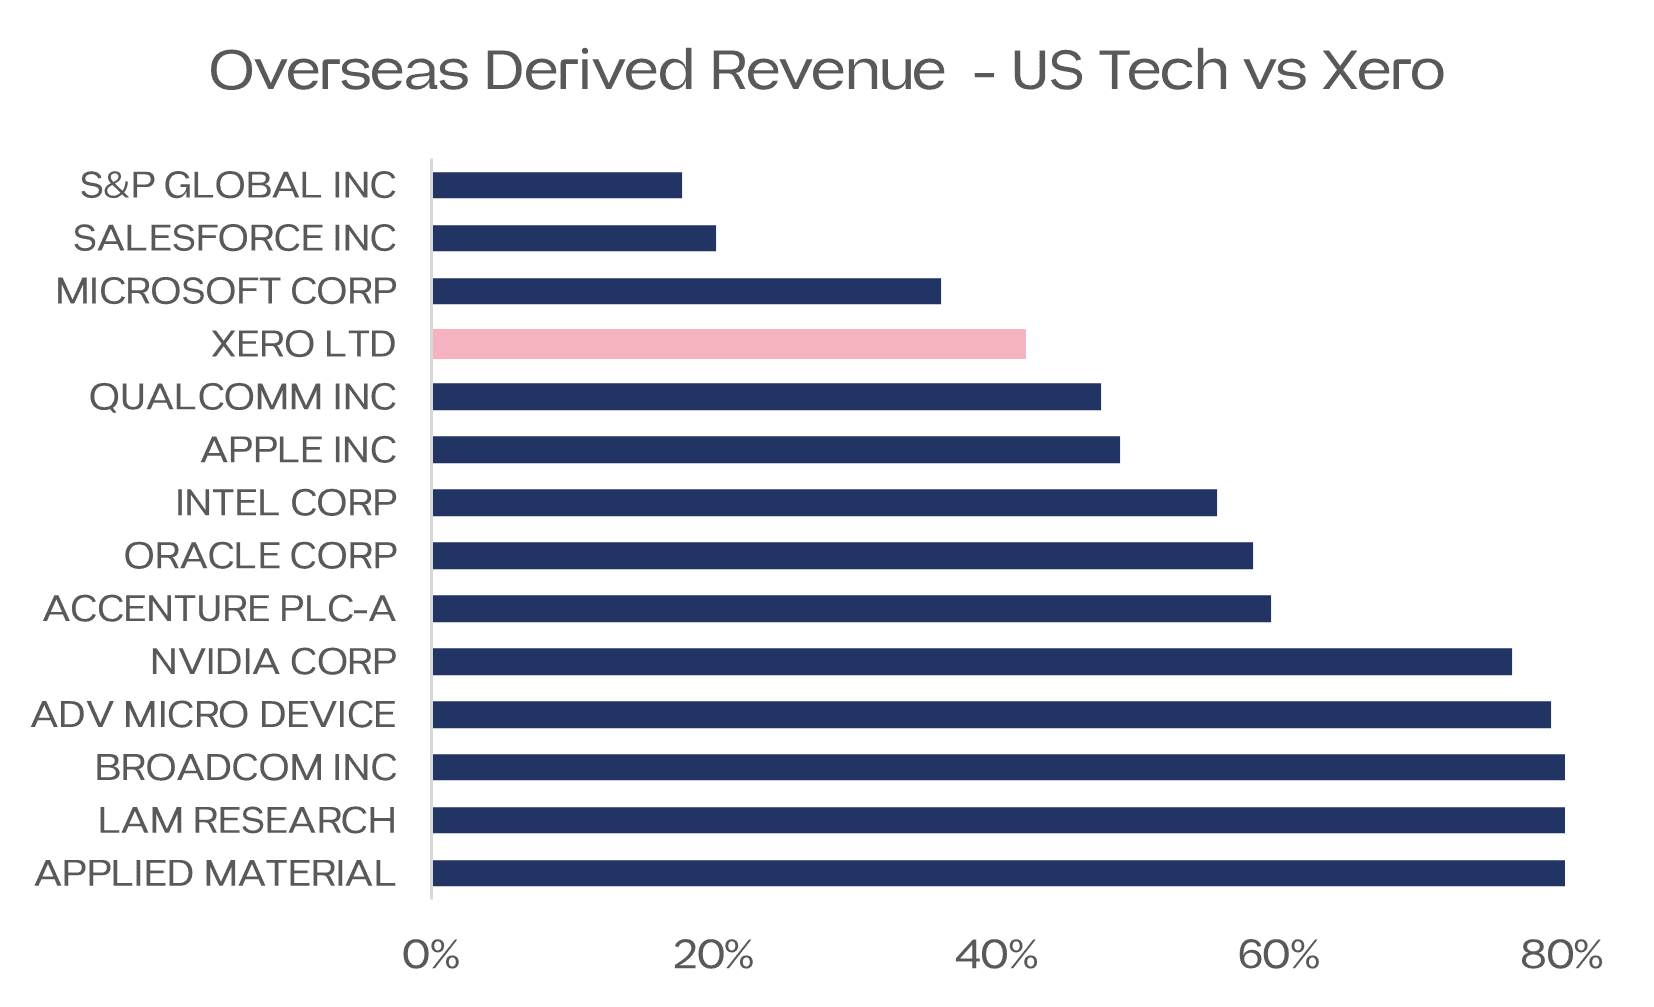
Source: Bloomberg as at 14 November 2025
By comparison, the US technology sector isn’t just large. It’s globally diversified, with most revenue streams earned outside domestic markets. So while Xero is one company serving a handful of regions. US mega caps have become the world’s operating system.
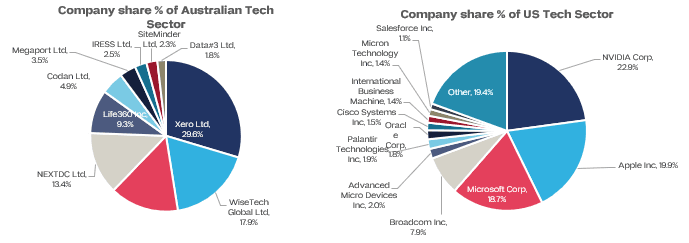
Chart 4 – Market Share of the top companies in Australia and US technology sector
Source: Bloomberg as at 14 November 2025
How investors can respond
If the goal is genuine tech exposure, investors should look beyond just a handful of local SaaS names.
Option 1: US technology ETFs
These provide access to:
- Diversified revenue streams across geographies
- Broader sector representation
- AI, semiconductors, cloud, cybersecurity, enterprise software
- Lower management fees compared with international funds
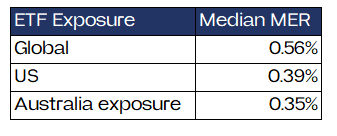
Table 2 – Median Fees for Australian listed ETFs providing different exposures
Option 2: Blend ASX tech with US Megacaps
Pairing local champions such as Xero, WiseTech, or Technology One them with global leaders reduces reliance on a small domestic sector and can stabilise overall portfolio risk
Final thought
Xero’s 17% fall wasn’t just a short term shock. It highlighted the structural risks in ASX technology. Including: limited names, concentration risk, and high valuations. Global diversification in technology isn’t optional, it’s essential. Australian investors can still participate in local tech success stories, but balancing them with global exposure can provides scale, resilience, and diversified returns.
Broad US Technology ETFs listed in Australia, such as ETFS US Technology ETF (ASX: WWWW, listing date 20/11/2025), provide diversified exposure to a wide range of leading US tech companies. This approach ensures investors participate in the growth of the sector without needing to select stocks themselves.
Disclaimer
The issuer of units in ETFS US Technology ETF (WWWW) (ARSN: 685 355 971) is the responsible entity of the Fund, being ETF Shares Management Limited (AFSL: 562 766). The product disclosure statement (PDS) and Target Market Determination (TMD) contains all of the details of the offer of units in the Fund. The PDS and TMD are available at www.etfshares.com.au. The value or return of an investment will fluctuate and an investor may lose some or all of their investment. Past performance is not a reliable indicator of future performance.