
Magnificent 7+ – The Investment Case
Summary
- The magnificent 7+ stocks have accounted for roughly half the wealth creation in the S&P 500 the past 5 years
- Their outperformance owes to superior earnings growth
- Looking forward, their R&D embeds optionality on emerging technology
- Valuations are higher, but there is no evidence of a bubble
Introduction
Sometimes characterised as the “FANGs”, “Magnificent 7+”, or “BAATMANN” stocks, the largest 10 companies on the Nasdaq have carried the US share market higher in recent years.
Over the past 5 years, the S&P 500 has created US$20.3 trillion in new wealth (i.e. net change market capitalisation). Remarkably, almost half – US$9.2 trillion – of this has been created by these 10 companies alone.
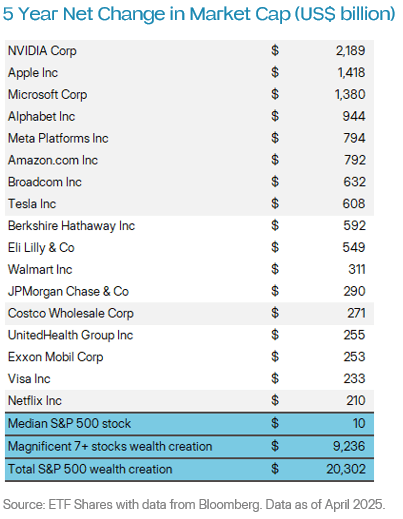
Putting these numbers in perspective, the entire market capitalisation of the ASX 200 in April 2025 was US$1.8 trillion. Meaning Nvidia alone has created more wealth in the past 5 years than the collective value of the entire ASX 200.
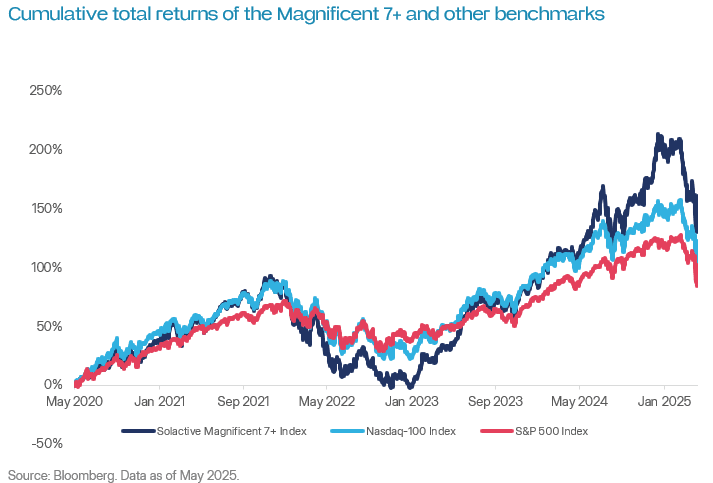
This means that the index of these companies, the Solactive Magnificent 7+ Index, has beaten both the S&P 500 and the Nasdaq 100 the past five years.
Outperformance is driven by fundamentals
The outperformance of these companies owes to their superior earnings. Not to hype or investor sentiment.
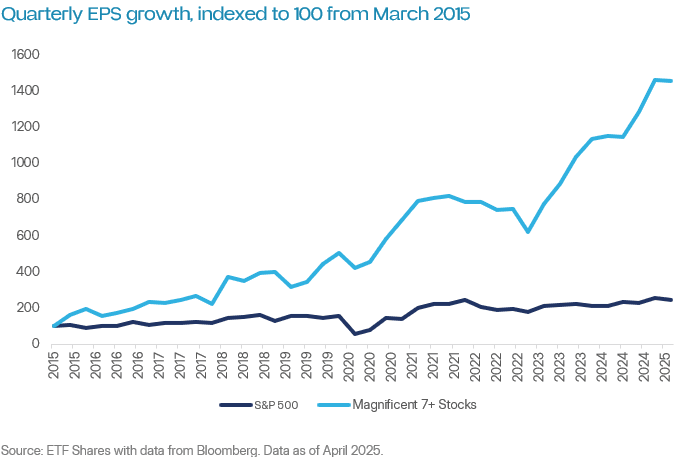
The earnings per share (EPS) of the Magnificent 7+ has grown on a CAGR of 29% over the past 10 years. By contrast, the EPS of the S&P 500 have grown on a 10-year CAGR of just 9%.
This consistent and steady earnings growth owes to the fixed infrastructure and competitive moats the Magnificent 7+ have developed. To give some examples:
- Amazon, Google and Microsoft have developed sever farms so vast that other companies cannot produce computing power as cheaply as they do. Anyone that wants to rent computing power (“cloud computing”) goes to them.
- Facebook and Netflix have built content libraries so large that recreating them is very difficult for any other company. Meaning anyone that wants entertaining content almost invariably goes to them.
- Tesla, Nvidia and Apple—uniquely—have made both the premium hardware in and the software that runs it in their respective fields. (Almost every other company in the technology sector makes either premium hardware or software—not both). Meaning if you want a top-shelf electric car, graphics card or iPhone you are locked into them.
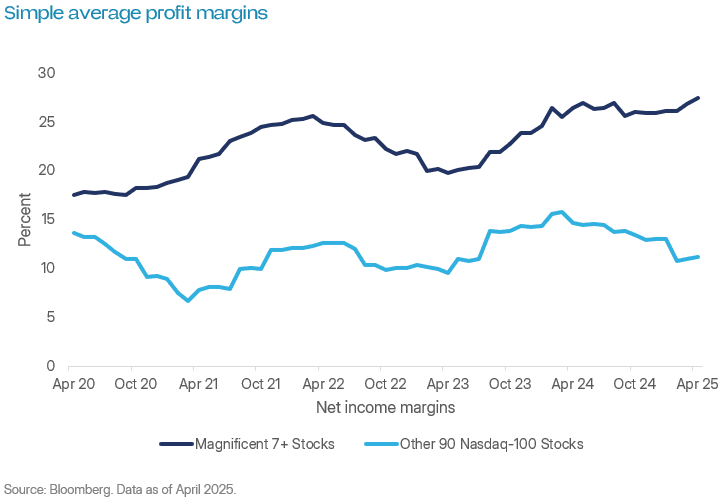
It bears repeating that the Magnificent 7+ dominate the premium end of their markets. This is where the marquee clients (viz., scale) and pricing power ( viz., profit margins) are. This is reflected in the graph above, which shows that since Covid-19, there has been a widening gap between the simple average profit margin of the Magnificent 7+ stocks and the bottom 90 stocks in the Nasdaq 100.
Going forward
While past performance was strong, investors may wonder whether the future will be as rosy. The curiosity is prevalent today, as the strong showing of the Magnificent 7+ since 2023 owes to the rise of AI, which has been digested and “priced in” by markets.
From where we sit, the investment thesis going forward for the Magnificent 7+ stocks centres around two things:
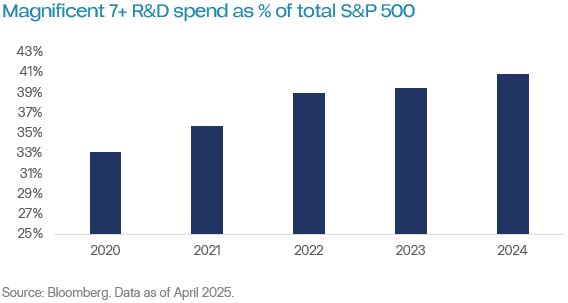
They recycle their cash flow into enormous research and development (R&D) budgets. They use their growing revenue to place ever-larger side bets on developing future tech, like self-driving cars and quantum computing. These side bets mean the Magnificent 7+ embed optionality on megatrends.
They acquire and investment in other companies at scale. The Magnificent 7+ operate something like venture capital and private equity companies in that they are constantly buying promising companies out and investing in startups. (For example, Broadcom was mostly built on acquisitions). Buying shares in the Magnificent 7+ therefore means you participate in VC and PE activity without the 2% management fee and 20% performance fee structure.
Are they overvalued?
Investors that may find the Magnificent 7+ stocks compelling often ask about valuations. These companies typically trade on higher multiples than the broad market. Some investors ask if the Magnificent 7+ are a bubble.
In our view, the higher valuations are justified—and we can see no evidence of a bubble. Why?
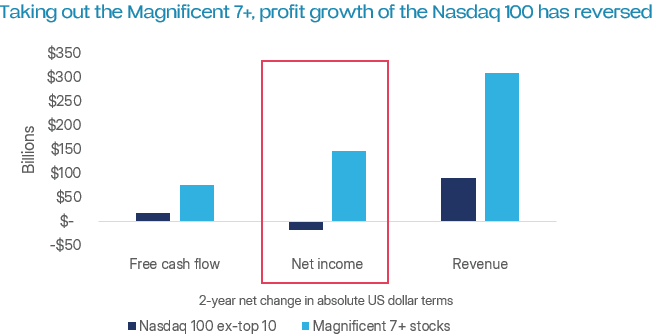
The growth – earnings, sales, cash flow – of the Magnificent 7+ is unlike anything else in the share market. If there is anything that the history of investing tells us it is that investors are willing to pay a premium for growth. To prove this point, if we take out the Magnificent 7+ stocks, profit (net income) growth on the Nasdaq 100 has gone backwards in aggregate the past two years. This is reflected in the graph below.
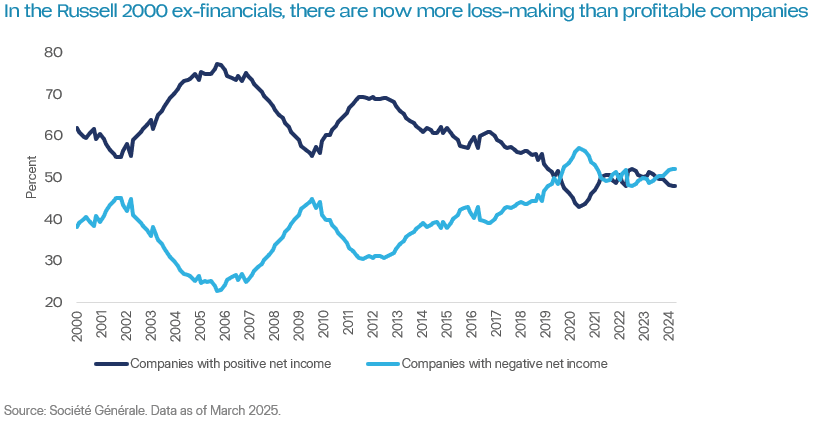
Furthermore, the kind of steady and reliable earnings growth that the Magnificent 7+ provide is becoming harder to find on the US share market. And when earnings growth is scarce, investors pay more for it. This can be seen in the chart below from Société Générale, which shows that among smaller US companies positive EPS is steadily diminishing.
Finally, we can see no evidence of a bubble in the Magnificent 7+. Their forward price-to-earnings (P/E) and enterprise value to sales (EV/Sales) ratios – the most common valuation multiples – are nearly half those of the dotcom leaders during their peak. Some numbers are high: such as the P/E ratio of Tesla and the EV/Sales ratio of Broadcom. But in our view make sense given Tesla supresses earnings and Broadcom’s acquisitions are debt financed. 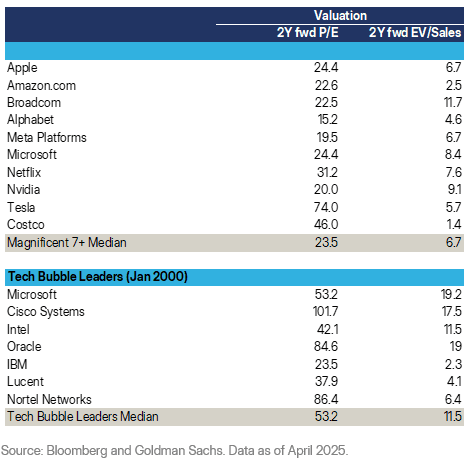
Conclusion
The Magnificent 7+ stocks have driven – and sometimes outrightly carried – the US and global share market higher on the back of superior earnings. Most recently, these earnings owe to AI. But thanks to their vast R&D spend, they have embedded optionality to future technologies too.
Related ETFs
ETFS Magnificent 7+ ETF (HUGE)
The Fund gives investors exposure to the largest 10 US companies on the NASDAQ Stock Exchange.
Management fee: 0.19% p.a.
Disclaimer: The issuer of units in ETFS Magnificent 7+ ETF (HUGE) (ARSN: 685 356 183) is the responsible entity of the Fund, being ETF Shares Management Limited (AFSL: 562 766). The product disclosure statement (PDS) for the Fund contains all of the details of the offer of units in the Fund. Copies of the PDS are available from ETF Shares Management Limited or at www.etfshares.com.au. In respect of each retail product, ETFS has prepared a target market determination (TMD) which describes the type of customers who the relevant retail product is likely to be appropriate for. The TMD also specifies distribution conditions and restrictions that will help ensure the relevant product is likely to reach customers in the target market. Each TMD is available at www.etfshares.com.au
The information provided in this document is general in nature only and does not take into account your personal objectives, financial situations or needs. Before acting on any information in this document, you should consider the appropriateness of the information having regard to your objectives, financial situation or needs and consider seeking independent financial, legal, tax and other relevant advice having regard to your particular circumstances. Any investment decision should only be made after obtaining and considering the relevant PDS and TMD.
Investments in any product issued by ETFS are subject to investment risk, including possible delays in repayment and loss of income and principal invested. None of ETFS, the group of companies, or their respective directors, employees or agents guarantees the performance of any products issued by ETFS or the repayment of capital or any particular rate of return therefrom.
Solactive AG (“Solactive”) is the licensor of Solactive Magnificent 7+ Index (the “Index”). The financial instruments that are based on the Index are not sponsored, endorsed, promoted or sold by Solactive in any way and Solactive makes no express or implied representation, guarantee or assurance with regard to: (a) the advisability in investing in the financial instruments; (b) the quality, accuracy and/or completeness of the Index; and/or (c) the results obtained or to be obtained by any person or entity from the use of the Index. Solactive does not guarantee the accuracy and/or the completeness of the Index and shall not have any liability for any errors or omissions with respect thereto. Notwithstanding Solactive’s obligations to its licensees, Solactive reserves the right to change the methods of calculation or publication with respect to the Index and Solactive shall not be liable for any miscalculation of or any incorrect, delayed or interrupted publication with respect to the Index. Solactive shall not be liable for any damages, including, without limitation, any loss of profits or business, or any special, incidental, punitive, indirect or consequential damages suffered or incurred as a result of the use (or inability to use) of the Index.
The value or return of an investment will fluctuate and an investor may lose some or all of their investment. Past performance is not a reliable indicator of future performance.