
US Quality – The Investment Case
Summary
- Quality investing – sometimes called “blue chip investing” – provides a way to remove debt-strapped and more lottery-like stocks from portfolios.
- Historically, quality stocks have recovered faster from drawdowns as “flight to quality” trade kick in.
- Quality factor index funds have outperformed the past 5 and 10 years, in contrast to other investment factors like size and value
Introduction
Among investment factors, quality has always been the black sheep.
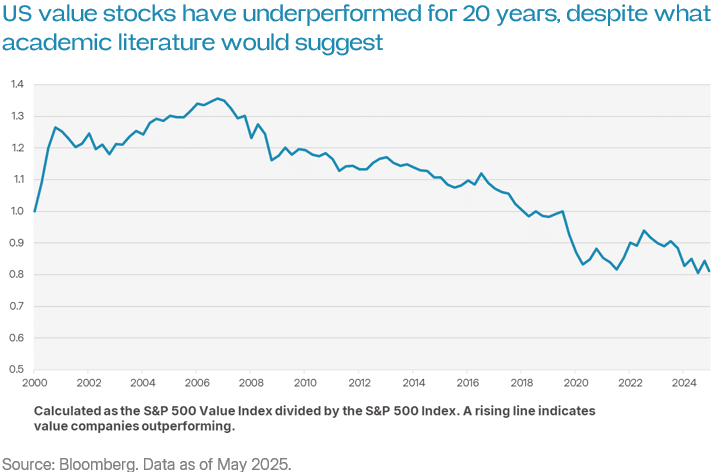
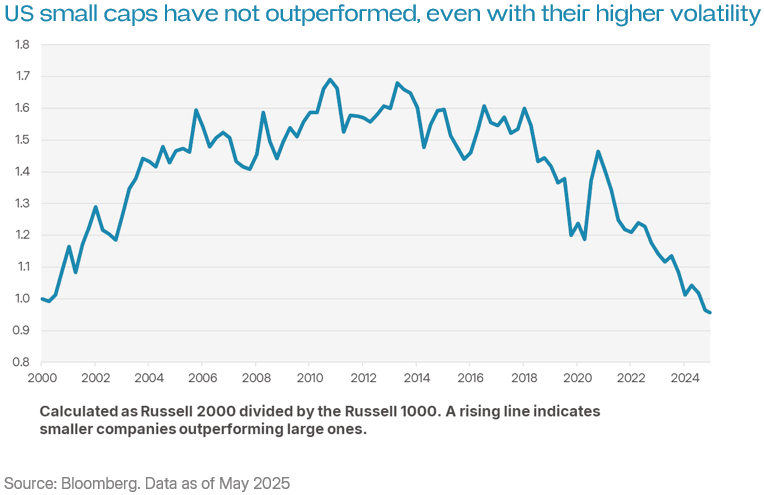
Size, value and momentum were all “discovered” by academics. Their existence – real or imputed – had plausible grounding in behavioural finance. And yet their promise of outperformance never materialised for ETFs. This is reflected in the charts below.
By contrast, quality was discovered by industry professionals – the face of which was Warren Buffett. It flies in the face of academic theory. And yet its promise of outperformance has often borne fruit for ETFs. Noting that past performance is not necessarily a guide to the future.
Quality: definition and significance
A “quality” company is what common sense would have you think. It is a company that is:
- Reliably cash flow positive;
- Free from debt problems; and
- Uses capital efficiently.
The accounting concepts used to capture these three points may differ. But the core characteristics of a ‘quality’ company are always the same.
Quality companies matter because evidence suggests they can give investors wanting capital growth better outcomes. These “better” outcomes include:
- Quicker recoveries during drawdowns, as quality companies’ more predictable cash flows make their shares trade more like bonds; and
- Superior returns in some market conditions, as they strip out more lottery like stocks and yield traps.
We explore each of these in more detail below.
What quality can do for investors: quicker recoveries
Shares are valued based on the market’s expectations of their discounted future cash flows. Analysts plug companies estimated future cash flows into spreadsheets and apply a discount rate, which represents the opportunity cost of capital.
Crucially, the discounting process is driven by risk. The more uncertain a company’s cash flows, the higher the discount rate applied.
When market volatility spikes, two things typically occur:
- Discount rates rise, as investors demand more compensation for risk; and
- Cash flow forecasts are revised downward, particularly for companies with fragile business models.
This double hit disproportionately affects lower-quality companies as they face both steeper discounting and reduced forward estimates. As a result, these companies often experience deeper drawdowns during periods of market stress.
Conversely, higher-quality companies — with more predictable cash flows — tend to fare better. Investors often buy these companies during bear markets in what's known as a "flight to quality." The evidence in the retracement table below shows how quality stocks typically recover faster than the broader market during bear markets.
| Weeks until complete recovery | Solactive US Quality Cash Flow Index | S&P 500 Index |
| 2008 Financial crisis | 220 | 254 |
| 2015 Oil crash | 30 | 44 |
| 2018 Taper tantrum | 27 | 28 |
| 2020 Covid crash | 20 | 25 |
| 2022 Great inflation | 89 | 101 |
Source: Bloomberg. Data as of May 2025.
What quality can do for investors: potential long-term outperformance
Investors buy shares for different reasons. Some investors are retirees chasing steady income. Other investors are capital constrained young people who want the chance to get rich quickly. Others are Bogleheads, who mechanically follow broad indexes.
This divergence matters. It means markets are not perfectly efficient, as textbook theory might suggest. Instead of everyone acting to maximise short-term utility, investors act on different priorities. This, in our view, opens the door for strategies like quality investing to outperform.
Importantly, quality investing avoids companies that aren’t on the stock market with a view to outperforming long term. Consider a few examples:
- Dividend-centric sectors — Companies in sectors like energy, utilities, and materials (and in Australia, financials too) are often owned for income. Management knows this and shapes business decisions accordingly, prioritising short-term payouts over long-term reinvestment. This can cause underperformance over time, and isn’t necessarily a problem for income-focussed shareholders.
- Real Estate Investment Trusts (REITs) — REITs are required to distribute most of their income and are generally restricted to their core property portfolios. They aren’t designed to reinvest for growth — and legally, often can’t. As income plays, they too serve a purpose for yield-hungry investors, but they rarely drive long-term capital growth.
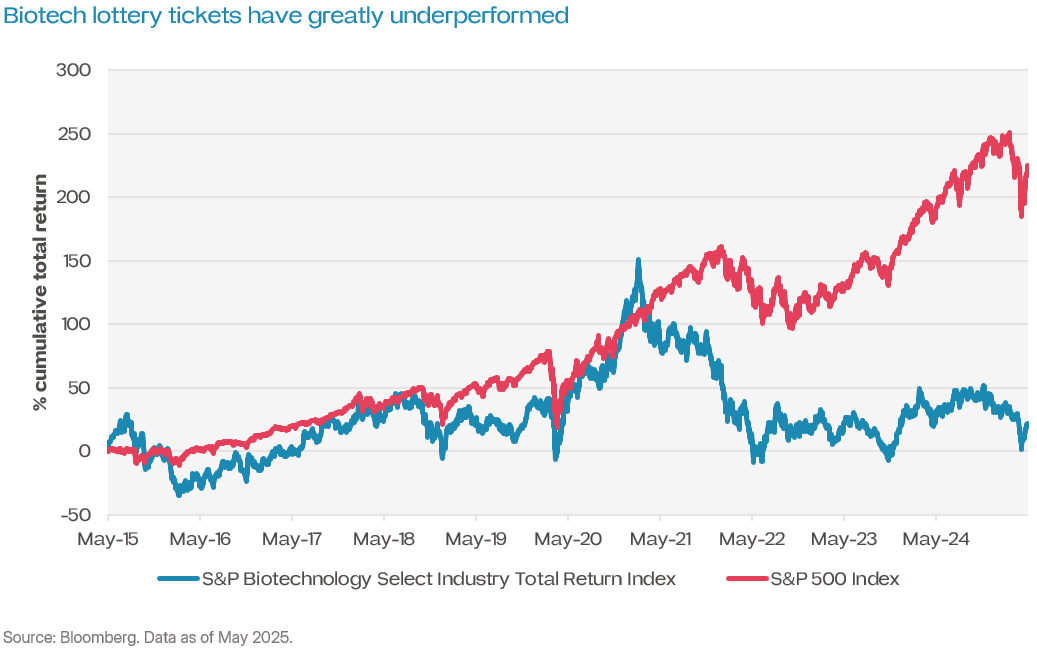
- Biotech microcaps and metals explorers — These are classic “lottery ticket” stocks. Pre-revenue and often aiming for a buyout by big pharma or a mining major, they attract punters looking for slim odds of getting rich quick. Behavioural finance shows that investors systematically overpay for this payoff.
Quality investing, by design, only buys companies on stable footing. It underweights yield traps (as they typically have more debt) and avoids lottery tickets (which lack stable positive cash flow). In so doing, it provides nearest thing to what is colloquially referred to as “blue chip investing”.
Our approach to quality
Quality means different things to different people. Academics note there is no agreed definition. For us, the best way to be a quality investor is through free cash flow.
Why? For one, it is very difficult to manipulate—unlike earnings which can be distorted by non-cash items or creative assumptions. For two, it is more relevant to investors, as it says how much cash is available to return to shareholders. For three, it captures capital intensity as it includes capital expenditures (again, unlike earnings).
Related ETFs
ETFS US Quality ETF (BEST)
The Fund gives investors exposure to 100 large US companies that have superior quality characteristics, as determined by the Index Provider. The Index Provider defines quality as free cash flow margin, and free cash flow return on invested capital.
Management fee: 0.29%.
Disclaimer: The issuer of units in ETFS US Quality ETF (BEST) (ARSN: 685 149 464) is the responsible entity of the Fund, being ETF Shares Management Limited (AFSL: 562 766). The product disclosure statement (PDS) for the Fund contains all of the details of the offer of units in the Fund. Copies of the PDS are available from ETF Shares Management Limited or at www.etfshares.com.au. In respect of each retail product, ETFS has prepared a target market determination (TMD) which describes the type of customers who the relevant retail product is likely to be appropriate for. The TMD also specifies distribution conditions and restrictions that will help ensure the relevant product is likely to reach customers in the target market. Each TMD is available at www.etfshares.com.au
The information provided in this document is general in nature only and does not take into account your personal objectives, financial situations or needs. Before acting on any information in this document, you should consider the appropriateness of the information having regard to your objectives, financial situation or needs and consider seeking independent financial, legal, tax and other relevant advice having regard to your particular circumstances. Any investment decision should only be made after obtaining and considering the relevant PDS and TMD.
Investments in any product issued by ETFS are subject to investment risk, including possible delays in repayment and loss of income and principal invested. None of ETFS, the group of companies, or their respective directors, employees or agents guarantees the performance of any products issued by ETFS or the repayment of capital or any particular rate of return therefrom.
Solactive AG (“Solactive”) is the licensor of the Solactive United States Quality Cash Flow Index (the “Index”). The financial instruments that are based on the Index are not sponsored, endorsed, promoted or sold by Solactive in any way and Solactive makes no express or implied representation, guarantee or assurance with regard to: (a) the advisability in investing in the financial instruments; (b) the quality, accuracy and/or completeness of the Index; and/or (c) the results obtained or to be obtained by any person or entity from the use of the Index. Solactive does not guarantee the accuracy and/or the completeness of the Index and shall not have any liability for any errors or omissions with respect thereto. Notwithstanding Solactive’s obligations to its licensees, Solactive reserves the right to change the methods of calculation or publication with respect to the Index and Solactive shall not be liable for any miscalculation of or any incorrect, delayed or interrupted publication with respect to the Index. Solactive shall not be liable for any damages, including, without limitation, any loss of profits or business, or any special, incidental, punitive, indirect or consequential damages suffered or incurred as a result of the use (or inability to use) of the Index.
The value or return of an investment will fluctuate and an investor may lose some or all of their investment. Past performance is not a reliable indicator of future performance.