
US Technology – The Investment Case
Summary
- The US technology sector has outperformed the past 10 years, as its fundamentals have been above other sectors
- The US remains the global hub for technology; going global for tech investors has led to under performance
- Dominant US sectors have remained dominant for half centuries without mean reversion
- Given their extremely dominant positions in productivity-boosting tech, disruption of US tech giants appears unlikely
Why they’ve done so well
The US technology sector has outperformed the past 10 years. It emerged from the ruins of the 2008 financial crisis, like Atlas, to hold up the sky of the US stock market.
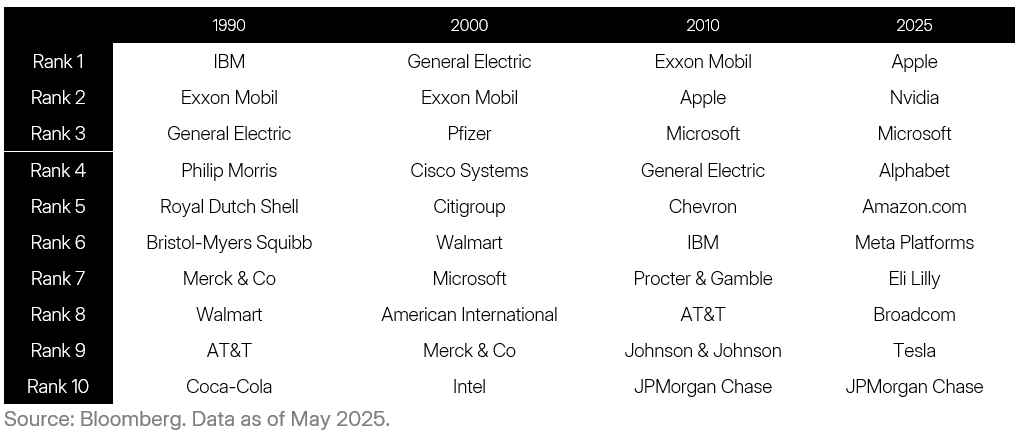
In 1990 only one technology (IBM) company ranked among the top 10 largest US companies. Today, the majority of the top 10 stocks are in tech—giving them an outsized influence on Wall St.
The unrelenting rise of US tech owes to it driving disruptive megatrends. The past 10 years has witnessed the exponential growth of technologies that have permanently changed social and work life. These include: social media, blockchain, work from home, self-driving cars, artificial intelligence—with more surely to come. In this setting, US tech companies’ fundamentals have broken away from the pack.
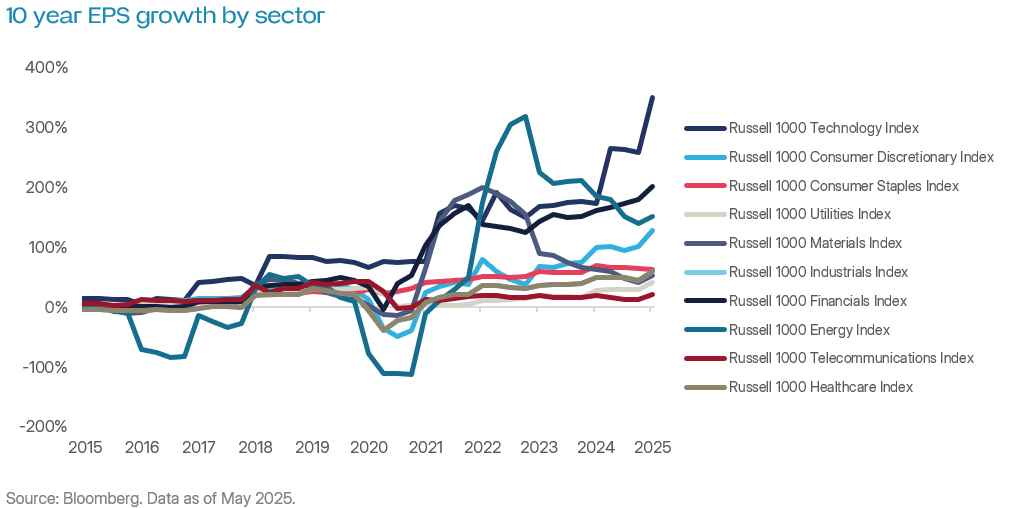
Tech companies’ earnings per share (EPS) growth has been both higher, and higher quality, than other sectors. This is reflected in the smooth upwards sloping trend in its EPS, as can be seen in the graphs below.
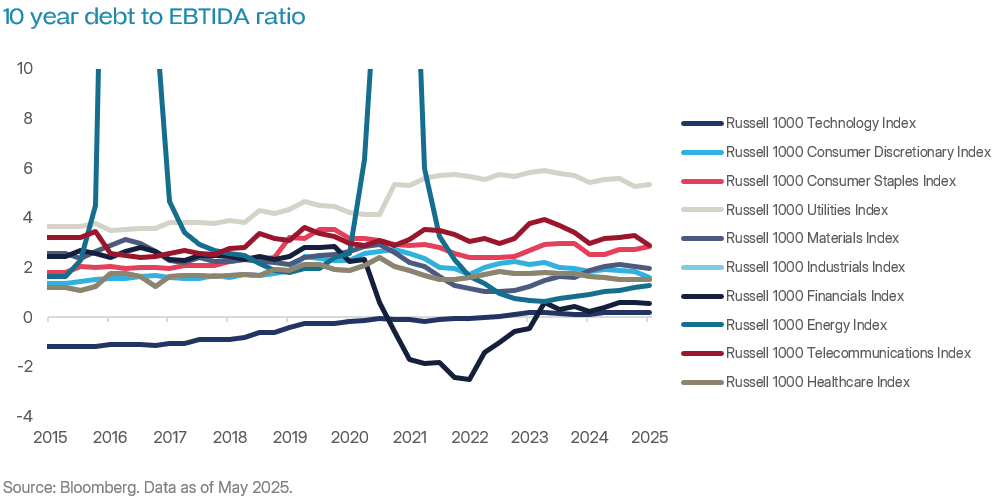
Earnings have grown without a meaningful increase in debt levels—another sign of high earnings quality. The debt to EBITDA ratio – which reflects how easily a company’s profits can cover any outstanding debt – is lower for tech than any sector. The ratio sits around zero, despite companies like Microsoft, Broadcom and Facebook making major debt financed acquisitions. (A negative debt to EBITDA ratio indicates a company has more cash on its books than debt).
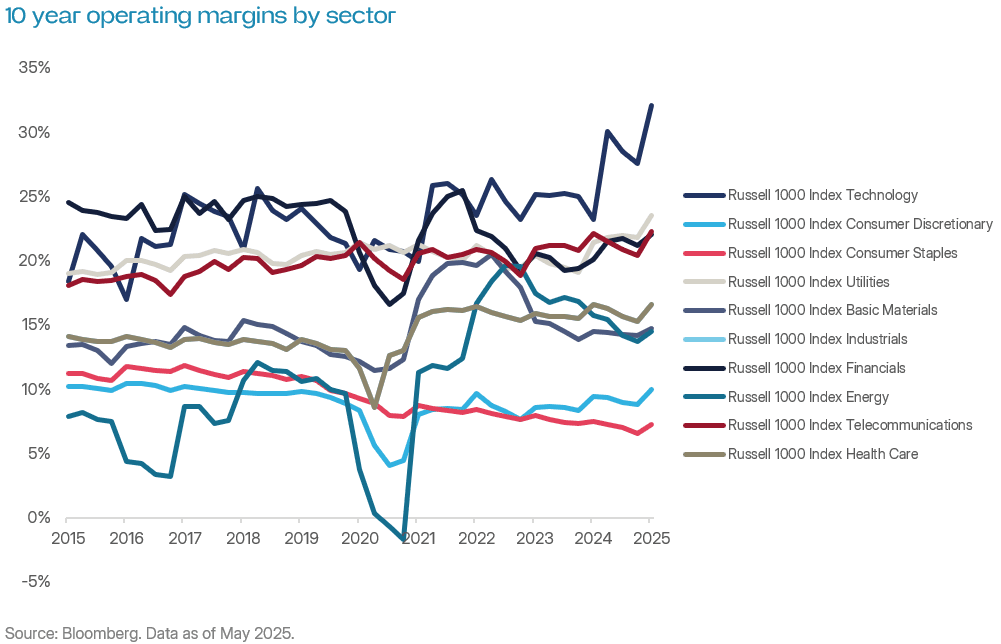
Most revealingly, however, operating margins are expanding and are now comfortably above every other sector. This matters because it indicates superior operating leverage and stronger competitive moats.
Why they may continue doing well
With the strong showing of US technology the past decade, its natural to ask whether the good times will continue rolling.
From where we sit, it seems likely, for a few reasons.
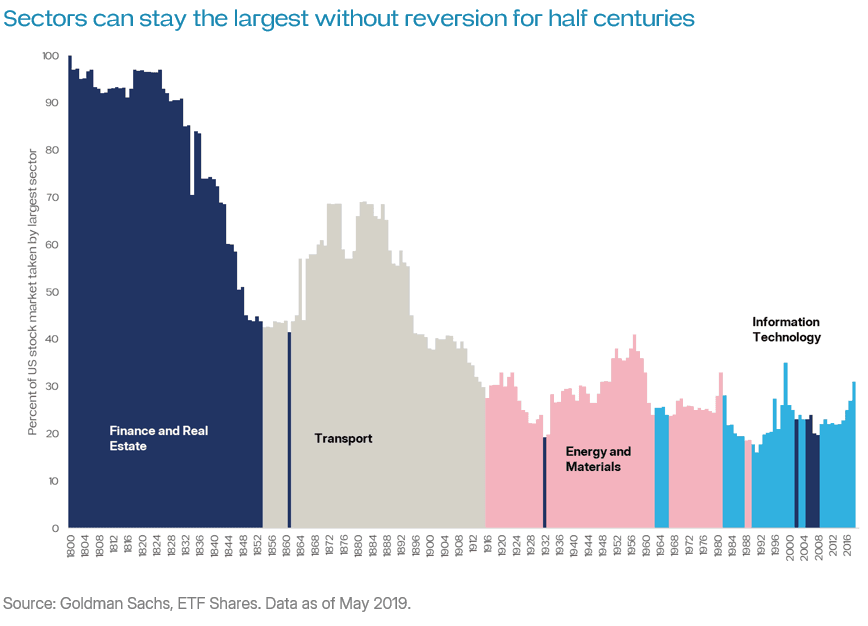
First, history shows dominant sectors can remain dominant for over half a century. Transport, finance and energy all took over 50 years each as the largest sector, research from Goldman Sachs indicates (graph below). Throughout these periods some sectors died completely – most notably the slave trade. While others have steadily faded into irrelevance, such as the transport sector on the back of Henry Ford’s car industry and public transport. Thus in our reading of history, sector performance is characterised more by permanent structural change than by mean reversion.
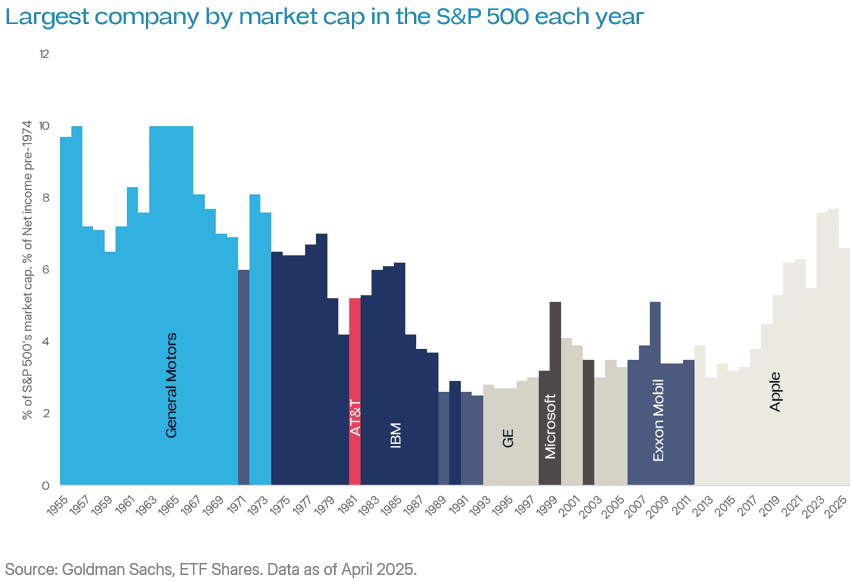
Something similar is true of stocks. Large companies can remain very large and continue growing for decades – even centuries. General Motors and IBM both held the number one spot for 20 years (graph below). While IBM has given up the number 1 spot, it has nevertheless continued growing. Microsoft has been in and out of the number one slot for almost 30 years now—growing all the while as well. Most notable of all however is ExxonMobil, which has been a feature in the top 10 US companies for 150 years, thanks to its history as part of Rockefeller’s Standard Oil.
Second, the strength of the largest US tech companies — which wield outsized influence over the sector — stems from their very dominant positions in core markets. The market share figures are striking: Google in search (~91%), Microsoft in productivity software (~90%), Nvidia in desktop graphics cards (~90%), and Apple’s exclusive control over iOS app distribution (100%). These dominant positions are buttressed by intellectual property laws, which give – in effect – legalised monopolies over proprietary tech. As things currently stand, for us, it’s hard to see where disruption could come from.
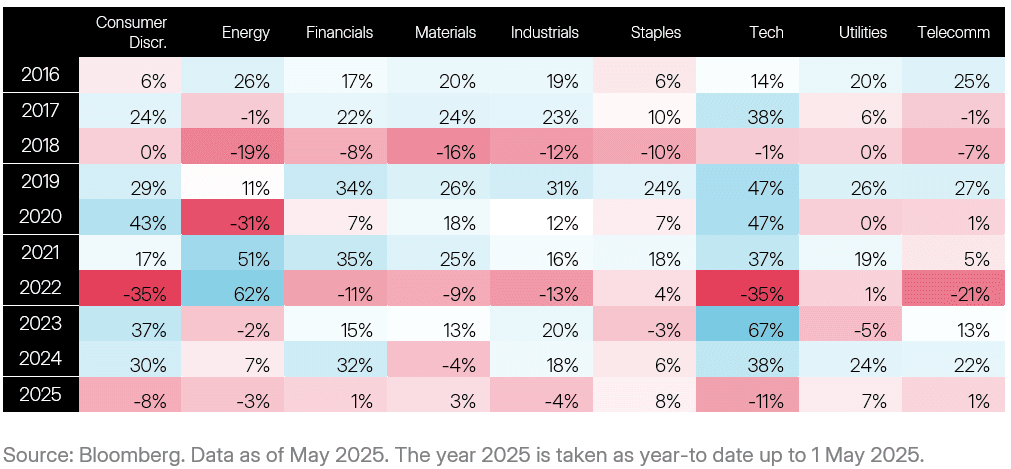
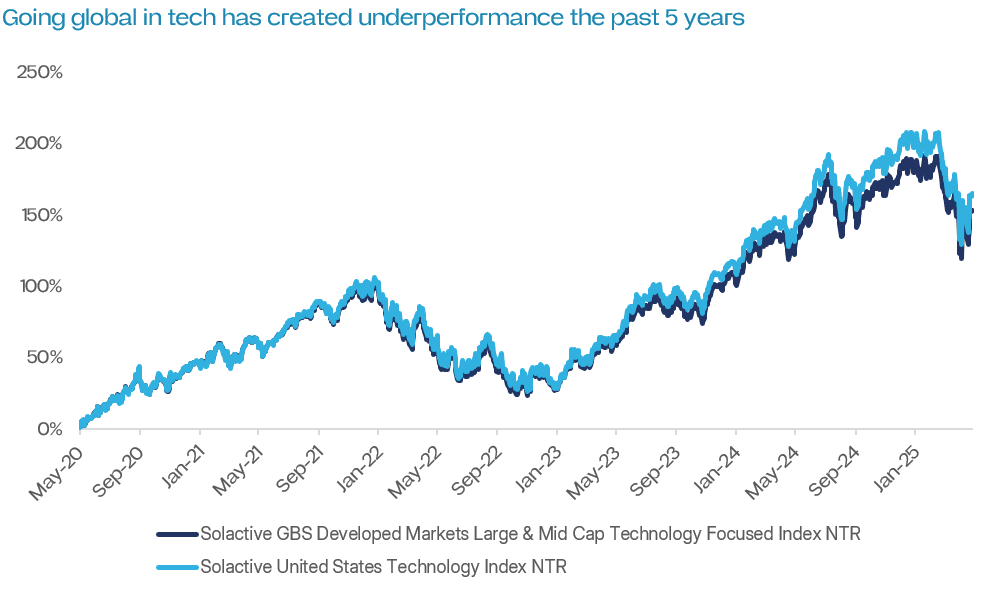
Third, it bears emphasis that for tech investors the US is exceptional and without a substitute. This is reflected in the graph below, which shows how adding other countries to a US tech sector allocation has caused underperformance over the past 5 years.
Uses in a portfolio
Investors considering US technology may wonder about where such an investment could fit in a portfolio. In our view, there are four main uses:
- As a replacement for thematic investing. Cybersecurity, semiconductors, artificial intelligence: driven by strong performance, investment “themes” like these have become popular with Australian investors. And yet, insofar as they have outperformed, their outperformance almost unfailingly owes to their overweighting or inhabiting the US technology sector. There is nothing wrong with this, of course. But in our view investing in the US technology sector directly may be a neater approach.
- Diversification given Australia’s lacking a tech sector. As Australia largely lacks a tech sector, there is a sense in which investing in US technology provides something of a completion tool or diversifier.
- An alpha tilt or side bet. For those wanting to express a view that the US technology sector may continue to trend higher. Investing directly in US technology is a logical way to proceed.
- As a pureplay exposure unachievable through major indexes. Major benchmarks have become more tech-heavy the past 10 years. Examples include the S&P 500 (~30%), the Nasdaq 100 (~55%), MSCI World (~24%). However those wanting a pureplay exposure to tech may consider allocating directly.
Related ETFs
ETFS US Technology ETF (WWWW)
The Fund gives investors exposure to the largest and most liquid US technology companies.
Management fee: 0.29% p.a.
Disclaimer: The issuer of units in ETFS US Technology ETF (WWW) (ARSN: 685 355 971) is the responsible entity of the Fund, being ETF Shares Management Limited (AFSL: 562 766). The product disclosure statement (PDS) for the Fund contains all of the details of the offer of units in the Fund. Copies of the PDS are available from ETF Shares Management Limited or at www.etfshares.com.au. In respect of each retail product, ETFS has prepared a target market determination (TMD) which describes the type of customers who the relevant retail product is likely to be appropriate for. The TMD also specifies distribution conditions and restrictions that will help ensure the relevant product is likely to reach customers in the target market. Each TMD is available at www.etfshares.com.au
The information provided in this document is general in nature only and does not take into account your personal objectives, financial situations or needs. Before acting on any information in this document, you should consider the appropriateness of the information having regard to your objectives, financial situation or needs and consider seeking independent financial, legal, tax and other relevant advice having regard to your particular circumstances. Any investment decision should only be made after obtaining and considering the relevant PDS and TMD.
Investments in any product issued by ETFS are subject to investment risk, including possible delays in repayment and loss of income and principal invested. None of ETFS, the group of companies, or their respective directors, employees or agents guarantees the performance of any products issued by ETFS or the repayment of capital or any particular rate of return therefrom.
Solactive AG (“Solactive”) is the licensor of the Solactive United States Technology Index (the “Index”). The financial instruments that are based on the Index are not sponsored, endorsed, promoted or sold by Solactive in any way and Solactive makes no express or implied representation, guarantee or assurance with regard to: (a) the advisability in investing in the financial instruments; (b) the quality, accuracy and/or completeness of the Index; and/or (c) the results obtained or to be obtained by any person or entity from the use of the Index. Solactive does not guarantee the accuracy and/or the completeness of the Index and shall not have any liability for any errors or omissions with respect thereto. Notwithstanding Solactive’s obligations to its licensees, Solactive reserves the right to change the methods of calculation or publication with respect to the Index and Solactive shall not be liable for any miscalculation of or any incorrect, delayed or interrupted publication with respect to the Index. Solactive shall not be liable for any damages, including, without limitation, any loss of profits or business, or any special, incidental, punitive, indirect or consequential damages suffered or incurred as a result of the use (or inability to use) of the Index.
The value or return of an investment will fluctuate and an investor may lose some or all of their investment. Past performance is not a reliable indicator of future performance.